In a recent report titled "Wassertemperatur im Mittelmeer um 2-6 Grad wärmer als normal" by WDR, a prominent German broadcaster, questions have been raised regarding the nature of the information presented. Rather than a neutral dissemination of facts, it appears that the report carries an underlying bias.
In Southern Europe, forest fires are breaking out. Elsewhere, there are heavy rains, landslides, and enormous hailstones. Is everything still normal? No, "this is what happens when the climate changes," says WDR meteorologist Sven Plöger. "A tsunami is coming our way."
This sensationalism raises concerns about the accuracy and objectivity of the content presented. However, amidst the potential political biases, there is also room for factual clarity and understanding. One valuable resource for those seeking accurate and unbiased data related to marine environments is the Copernicus Marine Service
This platform offers a comprehensive view of various oceanic metrics and trends. A simple visit to the Copernicus Marine Service can reveal a different perspective.
Specifically, on August 11, 2023, the reported surface water temperatures at a depth of 0 meters were notably lower than those recorded during the same period in the previous year, 2022. This observation highlights the dynamic and fluctuating nature of ocean temperatures, urging us to look beyond sensationalism and consider the broader context.
As consumers of MSM information, it is crucial to be discerning and critical those days. Before accepting any narrative at face value, it's essential to cross-reference multiple sources, verify claims, and consider potential biases. In an era where information spreads rapidly through various channels, maintaining a commitment to accuracy and objectivity is vital.
Below the surface temperatures
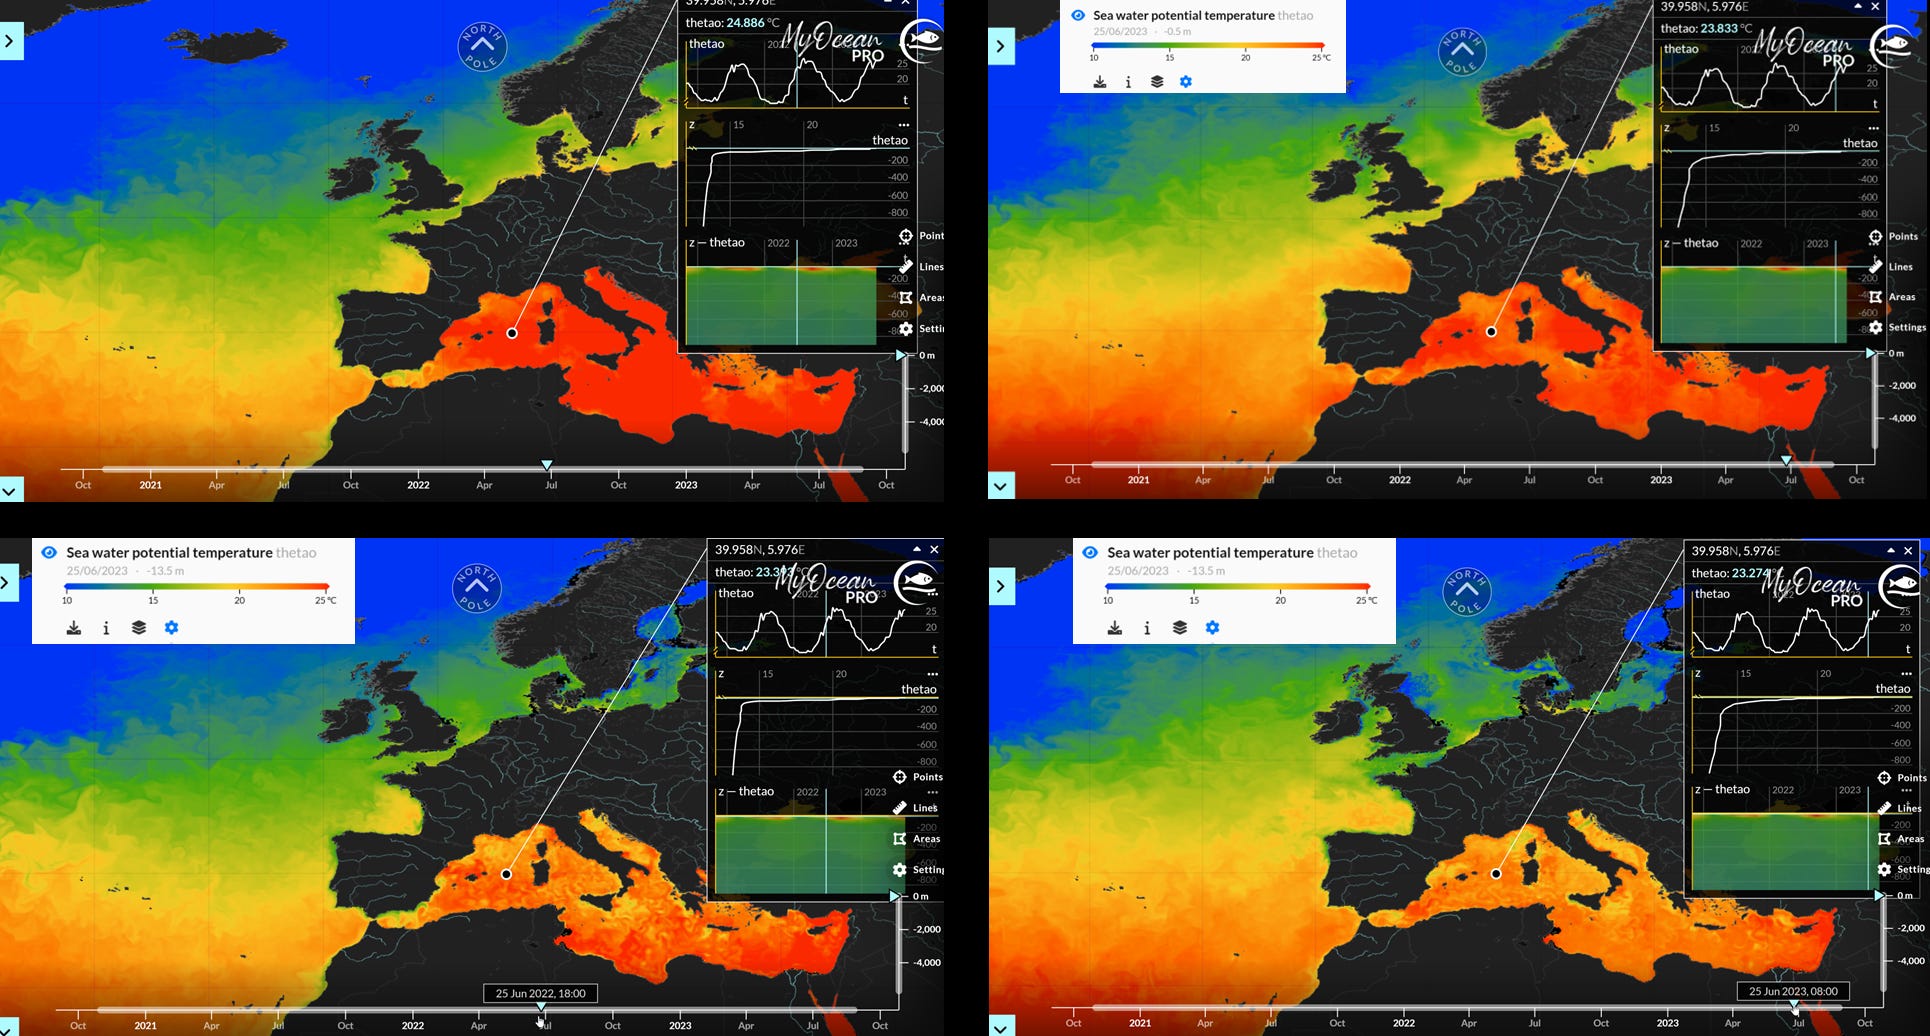
Now, let's delve into the depths, specifically -100 meters below the surface.
The color scale has been recalibrated to a 13-17 green red scale in order to highly magnify smaller temperature differences. The data at this depth is mainly derived from the Argo network. It's would be worth evaluating how well these SST MyOcean model matches the Argo buoy raw data. For now this check is out of scope.
Once again, there is nothing particularly unusual to note.
In the southeastern region, a slightly higher temperature can be observed, but it falls within the range of usual variations. As mentioned earlier, many regions experienced warmer conditions in 2022. Additionally, it's important to understand that the global sea surface temperature (SST) model does not operate with absolute precision.
Continuing our exploration, we refine our focus to a depth of -13 meters and turn our attention to June 25 in both 2022 and 2023. As we examine the data, with the uppermost row indicating the surface at 0 meters and the subsequent row indicating a depth of -13 meters, the obvious unfolds. The Mediterranean region is witnessing cooler temperatures beneath its waters this year, in contrast to the same period in the preceding year.
Bias from IR bigness derived temperatures
The tool is a data model. Complex interpolations are needed. The bias can be significant. Before relying on further derivatives like complex (global) average values from such models, it's essential to consistently verify/monitor the SST model's accuracy. The most effective way to achieve this is through cross-referencing with in-situ measurements from fixed buoys and raw data from Argo, among other sources.
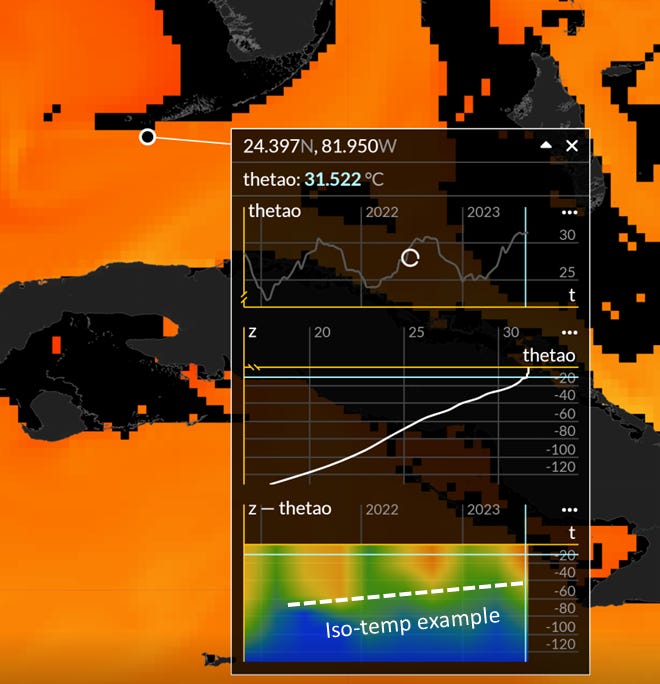
On days with extremely high heat, humidity, and calm winds, biases can emerge in the infrared-derived surface temperature (SST) product. Under such conditions, it is advisable to compare the results with in-situ measurements. Some examples of bias is shown below. The problem arises from the fact, that the SST tool seems to be dominated by satellite reading and not always bound to the in situ reference (it should be).
In situ: 30.9C, SST: 31.6C. There is probably less wind/waves on this side than in the Atlantic. One degree bias is visible.
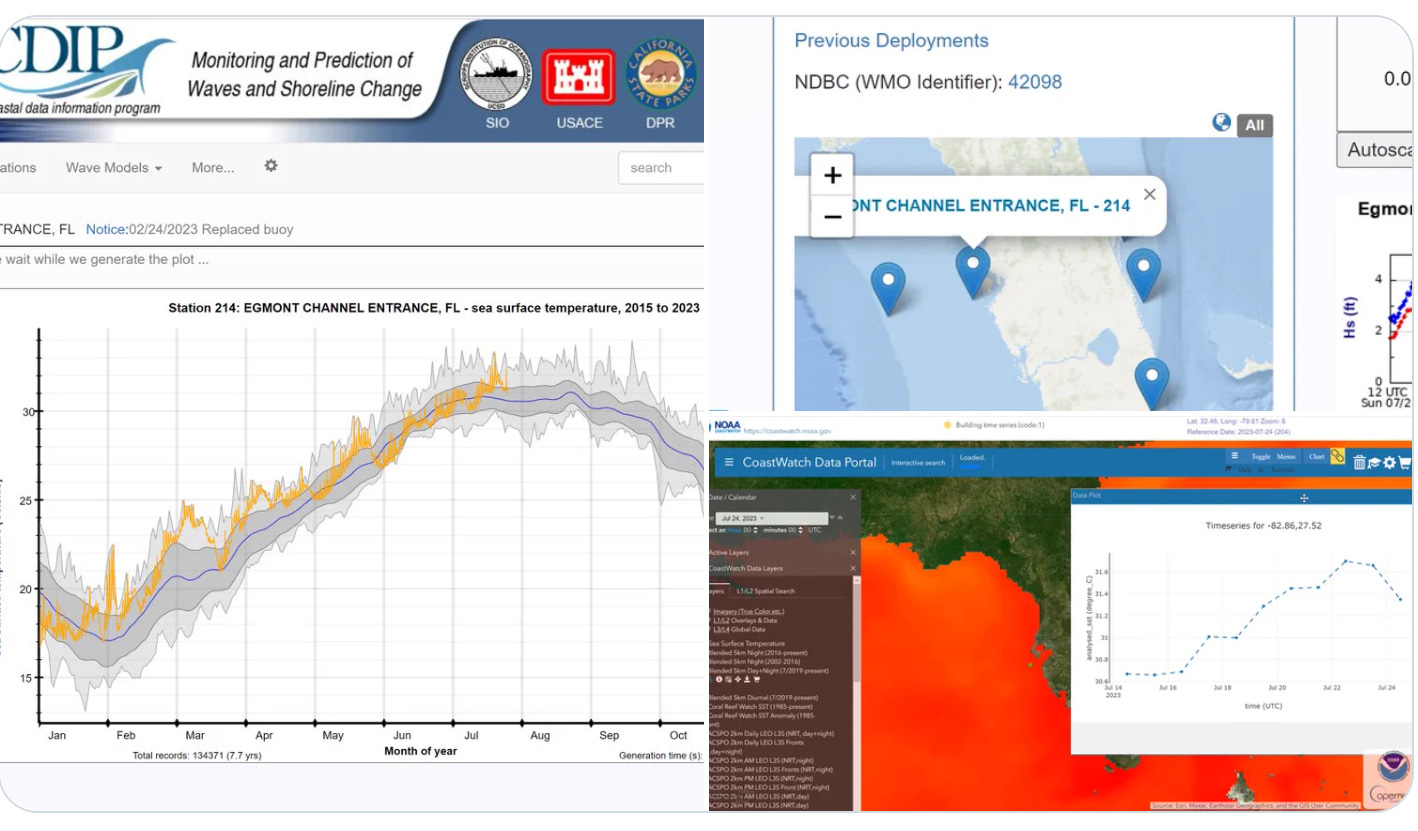
Example US FL - August 12th
Let's examine the data from two specific CDIP buoys:
ST. PETERSBURG OFFSHORE, 144
In-situ Temperature: 30.0°C
SST (Satellite Sea Surface Temperature): 31.9°C
Notably, there is an almost +2°C heat bias in the SST measurement.
The SATAN, 244
SST: 31.7°C
In-situ Temperature: 31.0°C
Here too, a slight heat bias is observed, amounting to +0.7°C.
These examples underscore the significance of recognizing and addressing potential biases in satellite-derived temperature measurements compared to direct in-situ measurements.
Beneath the surface, a contrasting narrative emerges. Temperatures have undergone a reversal, now registering as colder than those observed in recent years. The isotemperature line, depicted in white, slopes upwards, indicative of this shift. Interestingly, the deeper layers hold evidence of warmer trends for the years 2021 and 2022 in comparison to 2023.
This non-intuitive scenario can be attributed to the effects of calm weather (low wind and low waves) conditions. The same conditions that also create heat bias of the surface reading itself. In such weather, there is minimal mixing of the water layers, which allows the surface layer to cool more efficiently, resulting in a colder subsurface environment.
Argo float
As mentioned, the measurements below the surface are mainly derived from Argo buoy network.
Turning our attention to the question of heat content, its precision and relevance remains.
With a time series limited to 20 years roughly, and with only a single infrastructure, it's important to tread cautiously. True scientific inquiry should be characterized by independence and ease of verification. However, in this scenario, the challenges are significant. Not everyone possesses a submarine or a time machine.
Conclusion
In conclusion, while delving into oceanic data provides valuable insights, it's critical to approach the results with a balanced perspective. Careful consideration of the limitations and potential biases of various models and data sources is crucial for drawing accurate and meaningful conclusions.
Interestingly, scorching hot conditions (no wind, no waves, hot and humid) can give rise to two interconnected issues, which in turn enhance unnecessary alarm.
Firstly, as we've discussed, the satellite IR bigness derived temperature products can be heat biased up to several degrees, creating an inaccurate representation of actual reality.
Moreover, such calm water conditions lead to a counterintuitive consequence: a cooler temperature further beneath the water's surface/skin as the mixing of water layers is low without wind/waves. This phenomenon was strikingly observed in the delayed herring season in the Netherlands, where the warmer surface conditions contributed to unexpectedly colder waters.
This can contribute to unwarranted distorted public perceptions. It serves as a reminder of the intricate interplay between various natural factors, and how an overemphasis on water surface/skin temperatures can overlook the complexities at play in our oceans.
In light of these insights, my WDR fact-check verdict stands firm: the claim made is categorically false and significantly misleading. Such a stance is wholly unacceptable, especially from a public mainstream media channel. This departure from journalistic standards and ethical norms undermines the integrity of accurate reporting and responsible dissemination of information