


Netherlands: Age standardized comparison of the flu season 2018 with Covid-19 in 2020.
With a look on Sweden and other countries

Motivation
After the rather long article about the age standardization of mortality, we can now move on in exploiting this tool.
An obvious reoccurring question is: How did Covid-19 season compare with strong flu seasons?
We will focus on the Netherlands here.
Results over 20 years
The below graph shows the ESP2013 age adjusted weekly mortality over 20 years. We split the view by young / old age groups (left/right) and sex (bottom and top).

Beside 2018/2020, another feature stands out. What is it. 2006 week 30, but mainly females.

Overall, the following observations stand out:
The MH17 air crash accident which mainly killed the young. It is still visible in the 0-69 aggregation (but interestingly only for the males) although the main age of victims was below 40.
The young ( < 70 years old) don’t show seasonal excess mortality. Similar as with influenza, it mainly impacts the old above 70.
Both the 2018 and 2020 stand out.
2018/2020 female excess is comparable. On the male side, 2020 is slightly worse. Is this obesity and smoking?
NL 2006 heatwaves are visible (two heatwaves in 2006, which were among the longest ever). For females, it lead to almost the same age standardized mortality peak level as Covid-19 in 2020. Amazing isn’t it. But today with Covid-19 we panic.
Somewhat surprised, I started searching in the news for what happened in 2006:
The deadliest heat wave in Dutch history.
The peak mortality for females (age standardized) reached comparable levels as during Covid-19. That is quite astonishing considering the panic about Covid-19.
https://www.reuters.com/article/us-weather-netherlands-idUSKCN1UZ0GA
The death toll in the Netherlands during that week was comparable to the rate during two heatwaves in 2006, which were among the longest ever in the country, the researchers said.
About 300 of the additional fatalities were among people aged 80 years and older.
Most of the deaths occurred in the east of the Netherlands, where temperatures were higher and the heatwave lasted longer than in other parts of the country.
https://www.cbs.nl/en-gb/news/2018/33/heatwaves-caused-minor-rise-in-mortality
The long heatwave in the summer of 2006 caused mortality to rise by almost 400 per week. Statistics Netherlands (CBS) reports this based on preliminary weekly mortality rates.
There have been two nationwide heatwaves in 2018: from 15 through 27 July and from 29 July through 7 August. Likewise, 2006 had two heatwaves: from 30 June through 6 July and from 15 through 30 July. The second heatwave of 2006 lasted 16 days, one of the longest and most intense in over a century.
We can also adjust against the NL2011 and WHO2015 reference population for the sake of education. The main results are relatively independent (only the mortality scale changes but not trends and mortality rankings) against the choice of the standard population as demostrated in the theory article. It demonstrates why age standardized mortality analysis is needed in order to compare different years and different countries to the same population pyramid.

Our World in Data is however still focusing on absolute (pandemic cumulative) unadjusted all age C19 PCR labelled deaths. That makes no sense except if spreading fear is the their goal which I think and hope isn’t the case. They certainly have the skills to do it properly if they wanted (I managed in 2-3 days of work). They are challenged here to do so.
To put things in perspective we show the yearly standardized mortality over 20 year for two Netherlands and Austria (a very strict lockdown country). Netherlands did not show any significant difference to e.g. a country with some of the most harsh measures like Austria.


Covid-19 is comparable to a heavy flu season although it’s evident that it was a somewhat strong season. Still, even with Covid-19, the adjusted mortality wasn’t worse as in the years before 2000-2012.
We could argue, that age standardized mortality excess should be better be computed / forecasted excess against the declining mortality trend (which is the result of an improving wealth and health in general) instead of excess against an 5 year average. Using such a model (I added trend lines to make this visible), we could conclude that 2020 was a visible outlier, but certainly not on a scale that would justify a general panic like now. We also see that Sweden linear trend down is intact while stagnating in NL and AUT.

The below shows the trends for the 1-44 week time frame for 2015-2021. The problems in some country can’t be Covid related due to the control groups on the left which are keeping their record after record downward trend despite lockdowns, Covid-19, vaccinated or not. The bad result on the right, has a different underlying cause. Solve that instead of locking down and believing that mRNA is going to solve this. It won’t.

The problem of unadjusted mortality in aging populations which had a baby boom (Netherlands) is the following: There appears to be a problem as the crude mortality is going up. But what did we expect? That’s normal. The trend is still going down, although stagnating compared with the Nordic countries. But the root cause for this is not Covid-19 but wrong healthcare policies combined with other underlying population lifestyle habits.
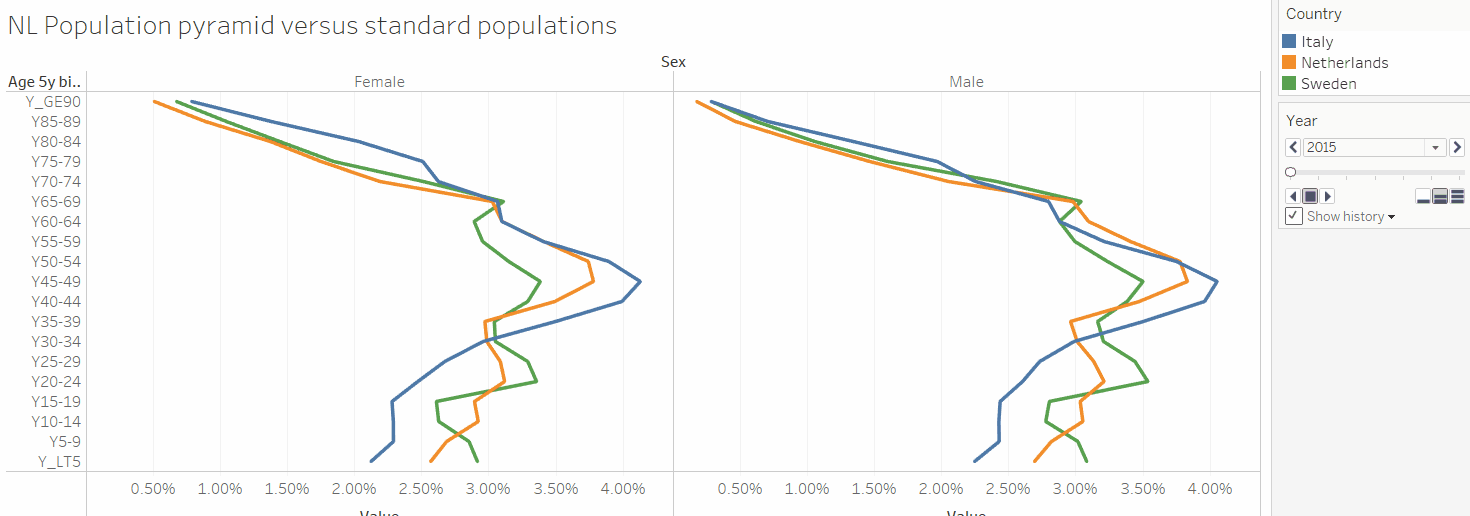
The difference between Sweden and Netherlands is the population pyramid. NL will face a larger problem that Sweden.
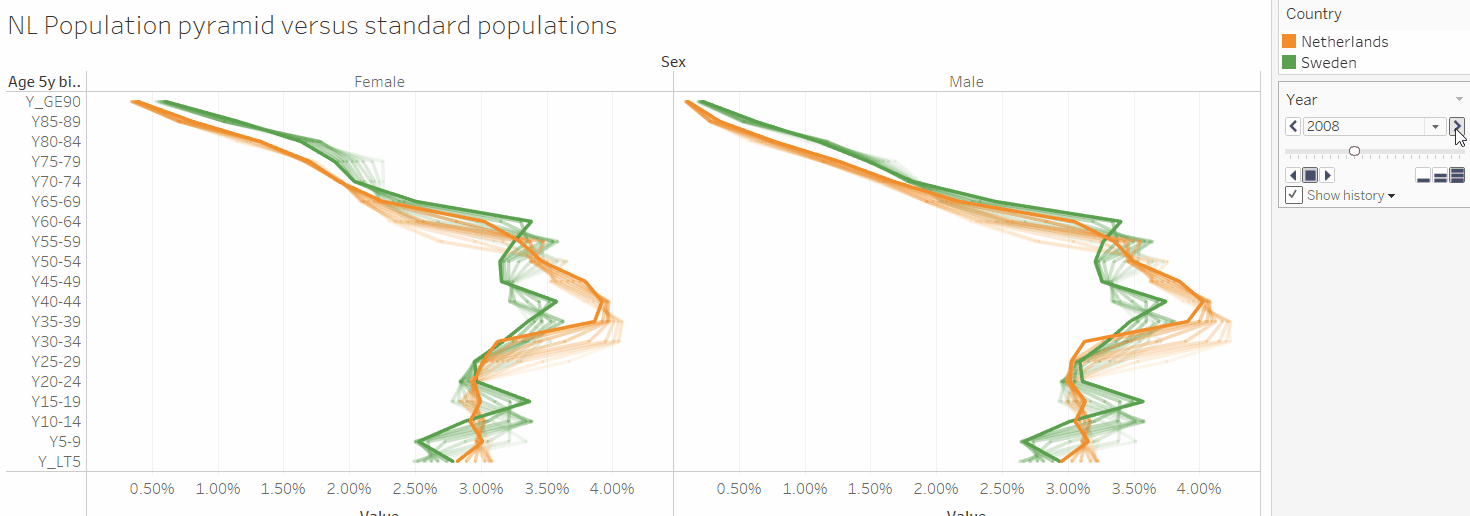
What will happen in Italy is a mortality Tsunami. And they have almost no young coming thereafter. A very bad combination.
Lesson learnt
This wise quote by @mr_Smith_Econ summarizes what I try to show.
Situatie: Een generatie na een babyboom volgt een sterfteboom. Ouderen van onze babyboomgeneratie zouden zich bovenstaand moeten realiseren. Hun levens worden niet verlengd met het vaccineren van kinderen, maar met het steken van handen in eigen boezems.
"A generation after a baby boom comes a mortality boom. Elders of our baby boomer generation should realize the above. Their lives are not extended by vaccinating children, but by putting hands into their hearts"
👉Benchmarking in time (comparing yearly results) and place (comparing countries) must be done on standardized mortality. Nothing else makes sense.
👉Sizing healthcare and elderly care infrastructure MUST be done on crude unadjusted ABSOLUTE numbers. The mortality boom is first manifesting as in hospital, elderly care and ICU boom. This must be prepared, built and scaled for. Because the death and age diseases boom when a big group ages at the same time is unavoidable and unstoppable.
👉Unadjusted ABSOLUTE forecast numbers are there for planning. The mortality boom (which first shows up as ICU boom) must be prepared for! This is an expensive but just a money action to take. Unadjusted ABSOLUTE mortality forecast numbers are however NOT a reason to panic in winter.
2020 The general hysteria unfolds
While MSM and the medical actors are pushing the panic in every flu season, they never managed to spark the hysteria. But this time it worked. A new mysterious “deadly virus” was need and the people were sold for the general and still ongoing panic. But those of us who can read data, and understand the Simpson’s paradox were not convinced.
The overreaction is very evident to anyone who wants to look and think independently. But most people can’t (or are too lazy to try) and rely on MSM and politics to tell them what to think about it.
2020 February: Testing useless
February 20th: Jaap van Dissel states in the technical briefing, that with the current knowledge he finds testing useless for people without symptoms.
In 2021, after the vaccination campaign, mass testing for events started.
16-03-2020 Rutte “We cannot shut down for years.”
March 16th: Television address by PM Mark Rutte, explaining the mitigation strategy (named ‘maximum control’) focused on the controlled buildup of herd immunity.
The reality is that coronavirus is here in our midst, and for the time being it is here to stay. Anyone who has had the virus is usually immune to it afterwards. The third option is that we keep working endlessly to contain the virus. That would mean shutting down the country completely. Such a rigorous approach may seem like an attractive option, but experts say that this would not be a matter of days or weeks.
In this scenario, we would essentially have to shut the country down for a year or even longer, with all the consequences that would entail. And even if that were possible in practice – making people stay in their homes unless they have permission to go outside, for such a lengthy period – the virus could simply rear its head again once the measures were lifted. The Netherlands is an open country.
2021: Lockdown after lockdown is what he did and keep doing with 95% vaccination level.
March15th:
The so-called 'intelligent lockdown' is announced. Schools, children day care centers, restaurants, pubs, gyms and more need to close. Pressure from society led to the decision to close schools. The 1,5 meter rule is introduced
March 17th: Veterinary GOF lady Koopmans enters the game with fear mongering based on false assumptions.
March 17th: Marion Koopmans, OMT member and virology professor, says on TV that, considering 50% would need to get infected for herd immunity and that the expected death rate is 1-2%, this would mean 40.000-80.000 deaths (correct= 86.000-172.000 deaths).
December 10, 2021: Marion Koopmans removed from WHO team (after an revealing article about her long-standing ties to the Chinese Communist Party) similar as EcoHealth Alliance CEO Peter Daszak.
Marion Koopmans – who served on the World Health Organization’s first COVID-19 origins investigation team – appears to have been removed from the body’s new “effort” to trace the source of the virus following the National Pulse revealing her long-standing ties to the Chinese Communist Party.
March 18th - This is funny. Baudet requesting lockdown.
Geert Wilders (PVV) and Thierry Baudet (FvD) submit a motion requesting full lockdown. All other parties vote against it. Baudet also submits a motion requesting explicit enouncement of not trying to attain herd immunity
Interestingly, this timeline article “Herd immunity in the Netherlands” was deleted. The truth shall be erased? Evidence which doesn’t fit the narrative removed quietly? We have seen similar stealth erasures in Germany (here and here).
Here is the archive.

Here we have Rutte is saying the obvious. It was true back then and still is now.
2018 Similar articles, but no panic
The following collection of videos from 2018 was done by Prof. Freedom. Similar articles can be found in many countries, for example in Austria.

Appendix
Forecast. We use NL2011 as standard population here to show how the crude mortality is increasing while the age standardized mortality is declining. This is the result of demographics.


Nice job!
Are you able with your tool to track excess mortality per week?
That could be interesting to understand for example what happens from week 22 of 2021 in Europe, for the age range 0-14, or for the age range 15-44:
https://joejoejoe.substack.com/p/strange-data-from-europe
I am trying to reproduce the curves of Euromomo with data from Eurostat, but the curves of excess mortality for the age range 0-14 look very different from the ones of Euromomo. I guess that this is due to the fact that I did not normalized the raw mortality data from Eurostat as you did.
Wonderful work! Please can you look at the euromomo mortality stats for 15-44 age range? It looks quite high, but it is not covid. And it keeps rising.