

Relation between the percentage of vaccinated people in hospitals, the vaccination level and vaccine efficiency (VE)
Relation between the percentage of vaccinated people in hospitals, the vaccination level and vaccine efficiency (VE)
A technical approach

1 Nov, 11 tweets, 8 min read
Background
The reporting (example NL) on the realtive ratio of vaccinated versus unvaccinated patients in ICU and hospitals has gained public and political attention. Those numbers are being used by to spread hysteria and also used to make the case for boosters and a waning vaccine efficacy (VE).
Two type of messages are being broadcasted:
“The majority (e.g. 90%) of the ICU patients are unvaccinated, we therefore urgently need to vaccinate.
“The majority (e.g. 70%) of the patients are vaccinated”. The vaccine is waning. It’s therefore urgently needed to re-vaccinate. “Get your booster.”
The sum of percent vaccinated and percent unvaccinated will however always give 100%. Yet, the relative numbers are being used by media to spread fear regardless if the vaccinated or unvaccinated are in the majority.
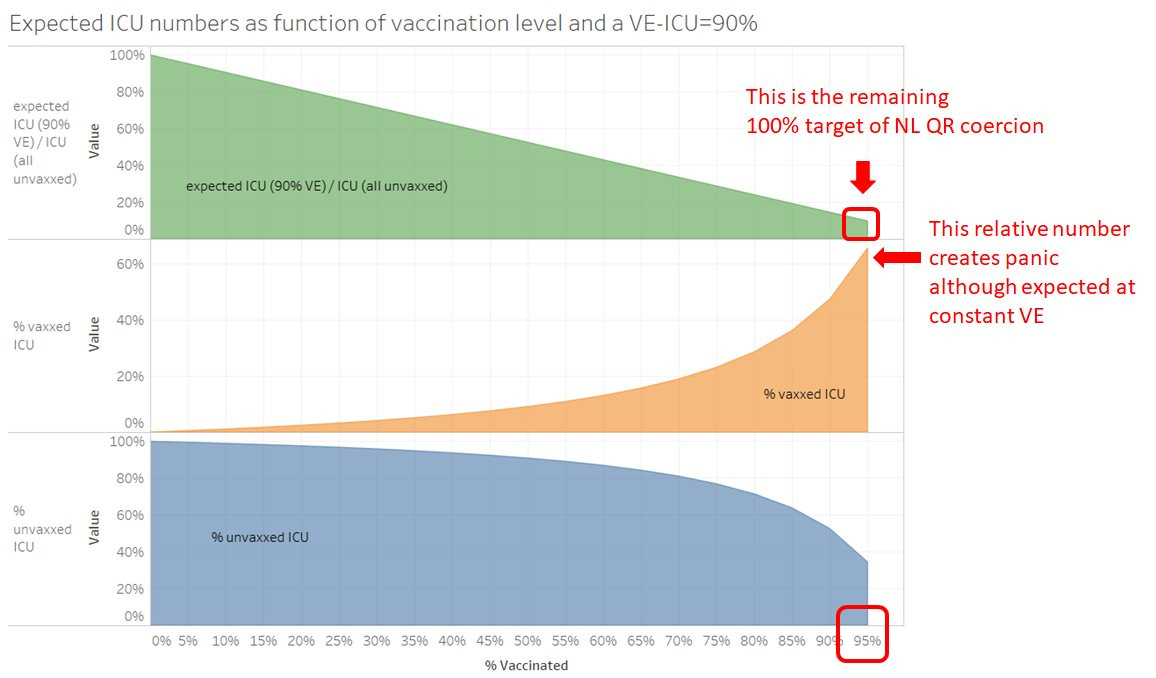
What is the target one should ask oneself (and the politicians). It’s obviously not possible for both numbers to be 10% at the same time.
With 100% efficacy, the share of unvaccinated will be 100%. With a less perfect efficacy, the situation becomes counterintuitive as shown on the example below with a VE of 90%.
The main message is, that while those relative numbers are interesting for scientists to estimate the vaccine efficacy (VE), the general public shouldn’t worry about them.
The only relevant number of interest for the general public is the total reduction of patients as function of the vaccination level and VE.
This is what really matters for the healthcare load: the absolute sum of vaccinated and unvaccinated patients.
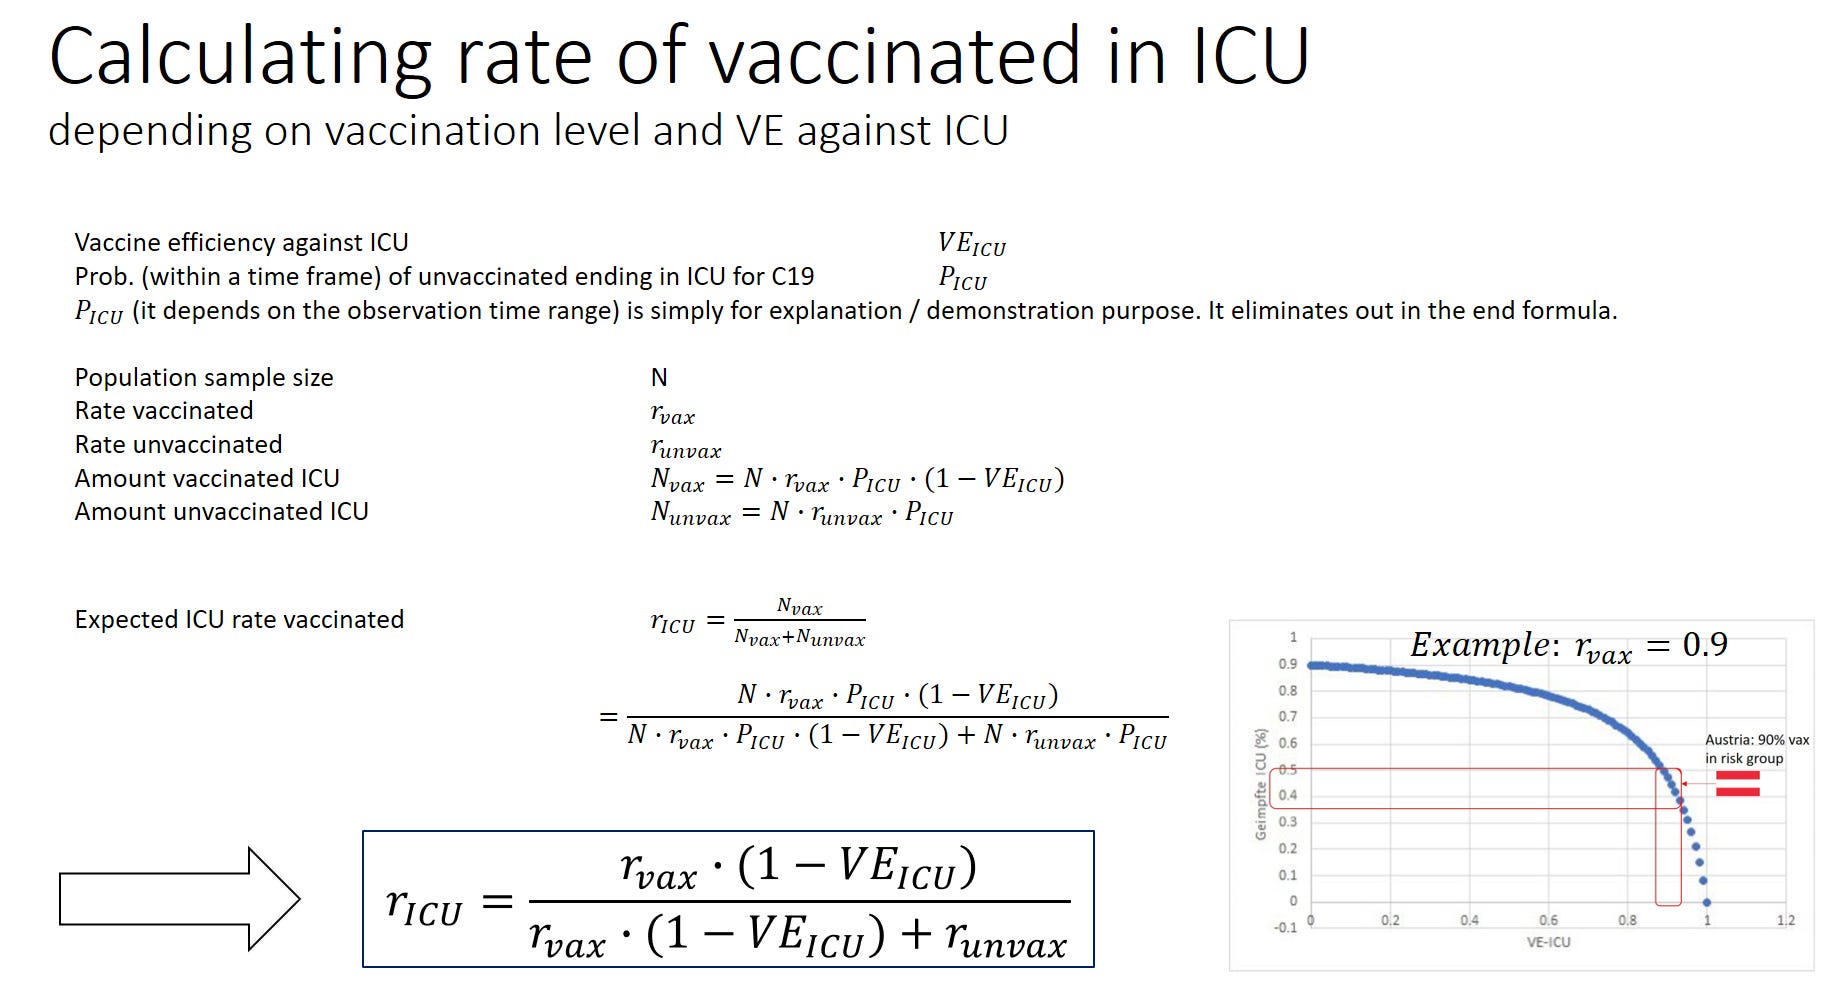
Calculating the rate of vaccinated patients in ICU
The equation is explained in the graph below. The result depends on the vaccination rate and the vaccine efficacy (VE).
The percent vaccinated patients in ICU (here r_ICU) can be expressed as:
r_ICU=(r_vax∙(1-VE))/(r_vax∙(1-VE)+r_unvax )
The special case for a vaccination level is shown on the right as function of the VE. It was representative for the vaccination level among the elderly risk group in Austria at the time of the original article.
In Austria and NL where 90% of the elderly (risk group) is vaccinated, we expect 30%-50% of the ICU patients to be vaccinated if assuming a VE-ICU of around 90%.
Despite observing what is theoretically expected (30%-50%), the main stream media continues to push panic and fear articles.
While this misunderstanding has been explained in this article, those relative numbers (regardless how they are) are being pushed in order to justify further vaccination and booster uptakes.
In the Netherlands, some progress on the education on this was made. RIVM published a related video.
Visualization of the results in 2D density plots
The percentage of vaccinated in the ICU depends on
vaccination level (x axis)
VE agains ICU (y axis)
The resulting rate of vaccinated is shown in the cell as value. It can be used as look-up table to estimate (roughly) the VE.
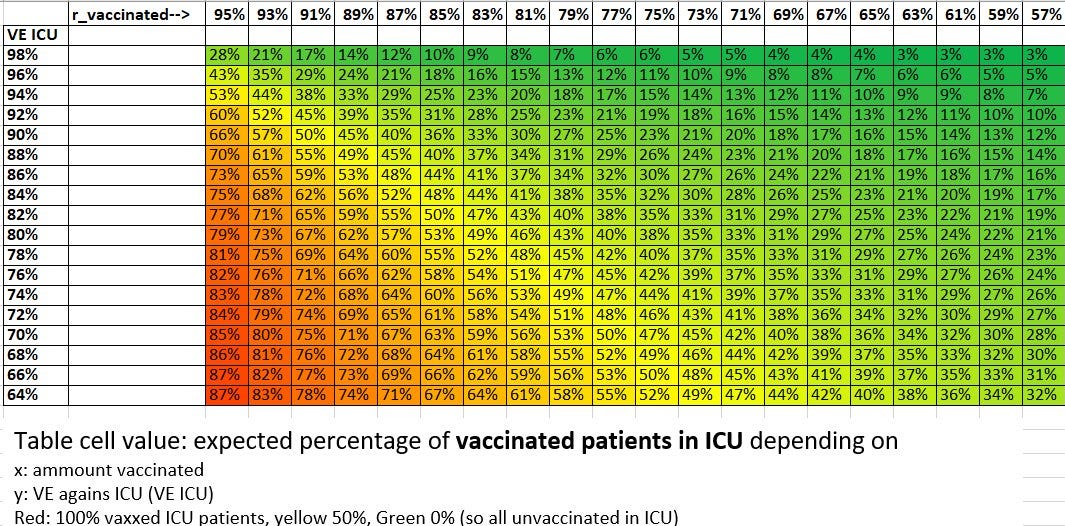
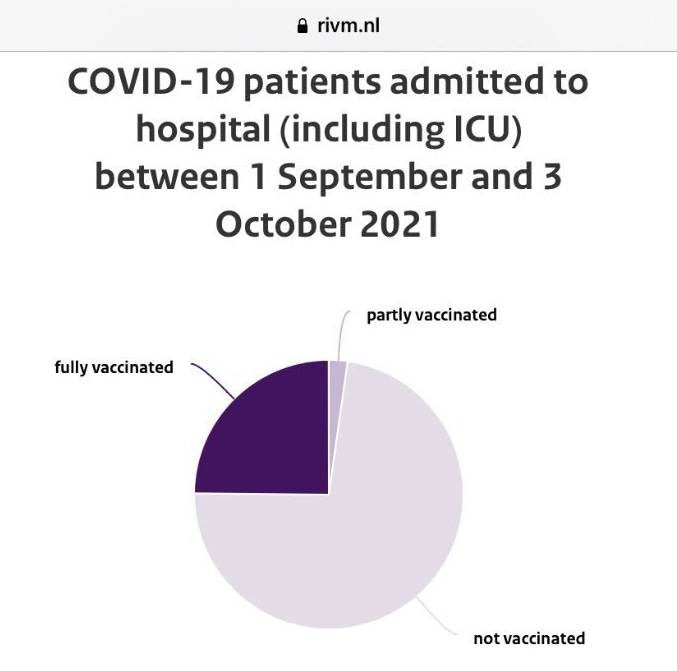
Example The Netherlands:
With around 90% vaccinated we expect 15%-50% vaccinated in ICU depending on the VE-ICU. RIVM reported around 15% (right). From this example, we can already estimate a VE-ICU of around 95%.

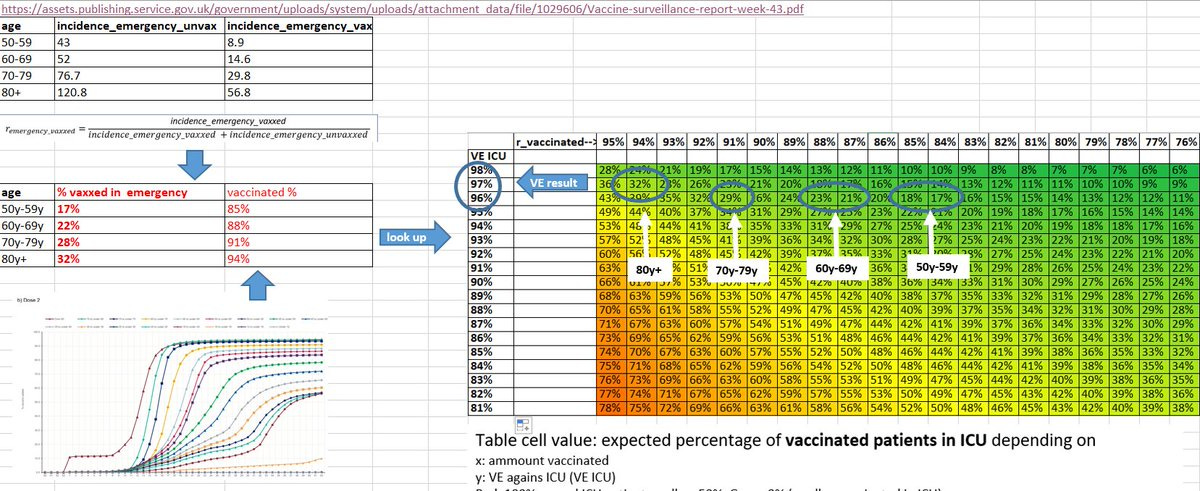
Look up example using UK PHE report week 43
Using the data from PHE report Table 5, we can now look up the expected VE with respect to emergency care by age group for 4 different age groups with different vaccination levels. The result gives a VE ~ 96% in each case.
Absolute total reduction of ICU patients
The relative number of vaccinated patients in ICU is irrelevant for the general public. It will increse both with the vaccination level and VE. Only the absolute total reduction of ICU patients matters as highlighted in the introduction:
1-(𝑟_𝑣𝑎𝑥∙(1−𝑉𝐸_𝐼𝐶𝑈)+𝑟_𝑢𝑛𝑣𝑎𝑥)
We can show the result of this for a range of combinations in a 2D contour table. The resulting reduction level is shown in the cell value.

With the example shown above for NL and AUT, a reduction of 90% is expected if assuming a VE of 90%-95%. There are only very small further gains possible despite the urge for pushing the vaccination levels to 100%.
Obviously, if the virus mutates, the waves (2020 to 2021) cannot be compared. This might be what is happening with the current Delta waves combined with pro-contagious measures which are pushed by the QR vaccine passports as the VE efficacy against infection and transmission is low to non-existent (see e.g. similar cases rates in the UK PHE reports).

1D view of the relation
Another way to visualize the same relation is shown below. Each line is now the relation for a different vaccination level. Those curves, are the vertical columns in the overall 2D plot.


Use example: waning VE in NL CWZ data
In this use example we can estimate the VE-ICU based on the hospital numbers "percent vaccinated in ICU" from NL CWZ. With values from various months, this allows the observation of the time evolution of the VE, in other words the waning of the VE.
A more elaborated version on this exampe is available separately in a dedicated article.
